Measure Relative Amplitudes of Electrogams at the Mitral Annulus
Table of contents
Background
This protocol was developed for a study measuring the relative amplitudes of the atrial and ventricular electrograms at the mitral valve annulus. It extends use of the voltage calipers.
Quickstart
Processing for this protocol is done entirely in Matlab. Use the helper function
runMVAExperiment()
The helper function will automatically save the point locations, distances and voltages. Manually save the MV annulus plane figure.
Analysis is done with one of two scripts
partIIIAnalysis; % analyse a single case
or
partIVRegionalAnalysis; % analyse summary data for all cases
The later of these scripts has to be edited to contain all the locations of the data files.
Detailed Instructions
Preparing and exporting Carto data
- Load case into the Carto system, and open the case for review.
- Click ‘Imaging’ and ‘Begin Carto Merge Study’ (it is now possible to see the segmented LA).
- Click ‘Study’ and ‘Export Study Data’. Select ‘Base’ and ‘CARTO VISITAG’ and click Export.
- Exit the study.
- Go to ‘System’ and ‘Export Data’; and move the file such as Export_Study-1-01_XXX into the USB drive labelling with the password Password1
Load Carto data into Matlab
- Unzip the Carto data using ‘The Unarchiver’
- Use importcarto_mem to read in the Carto data, see here for detailed instructions. N.B. Use branch feature-feature-update_code_for_CartoV3.6.0.60.70
% Import the data into Matlab
userdata = importcarto_mem;
Create a left atrial shell from the rotational angiogram
- Create a left atrial shell from the rotational angiogram (and to store the file’s location in
file3dravariable). This programme will ask you to select the mesh file (for example,LA.mesh); and the Study XML file.% Create a left atrial shell CartoMeshToVTK_Mesh_translated;
Label the clockface positions of the points
- Run
part0ElectrodeNumbering(file3dra, userdata) - Type the point indexes for the relevant electrograms into the boxes
- Click the button
- Run
POINTPOSITIONS = get(hAx, 'userdata')in the Command Window in order to get the data from the figure.part0ElectrodeNumbering(file3dra, userdata); POINTPOSITIONS = get(hAx, 'userdata');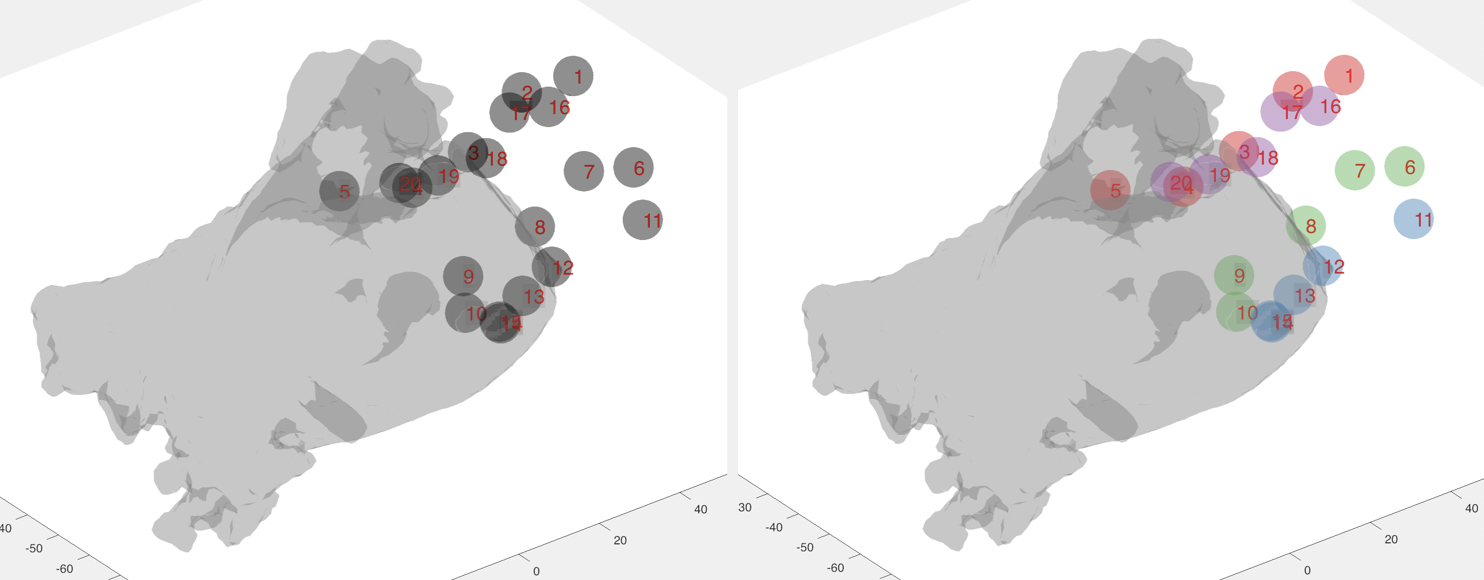
Define the mitral valve annulus plane
- Identify the mitral valve annulus plane using
partIDistances.m. Select points around the mitral valve annulus using left click. Use the Matlab figure camera toolbar to rotate the shell. Once done, click ‘q’ on the keyboard.% Identify the plane of the MV annulus partIDistances;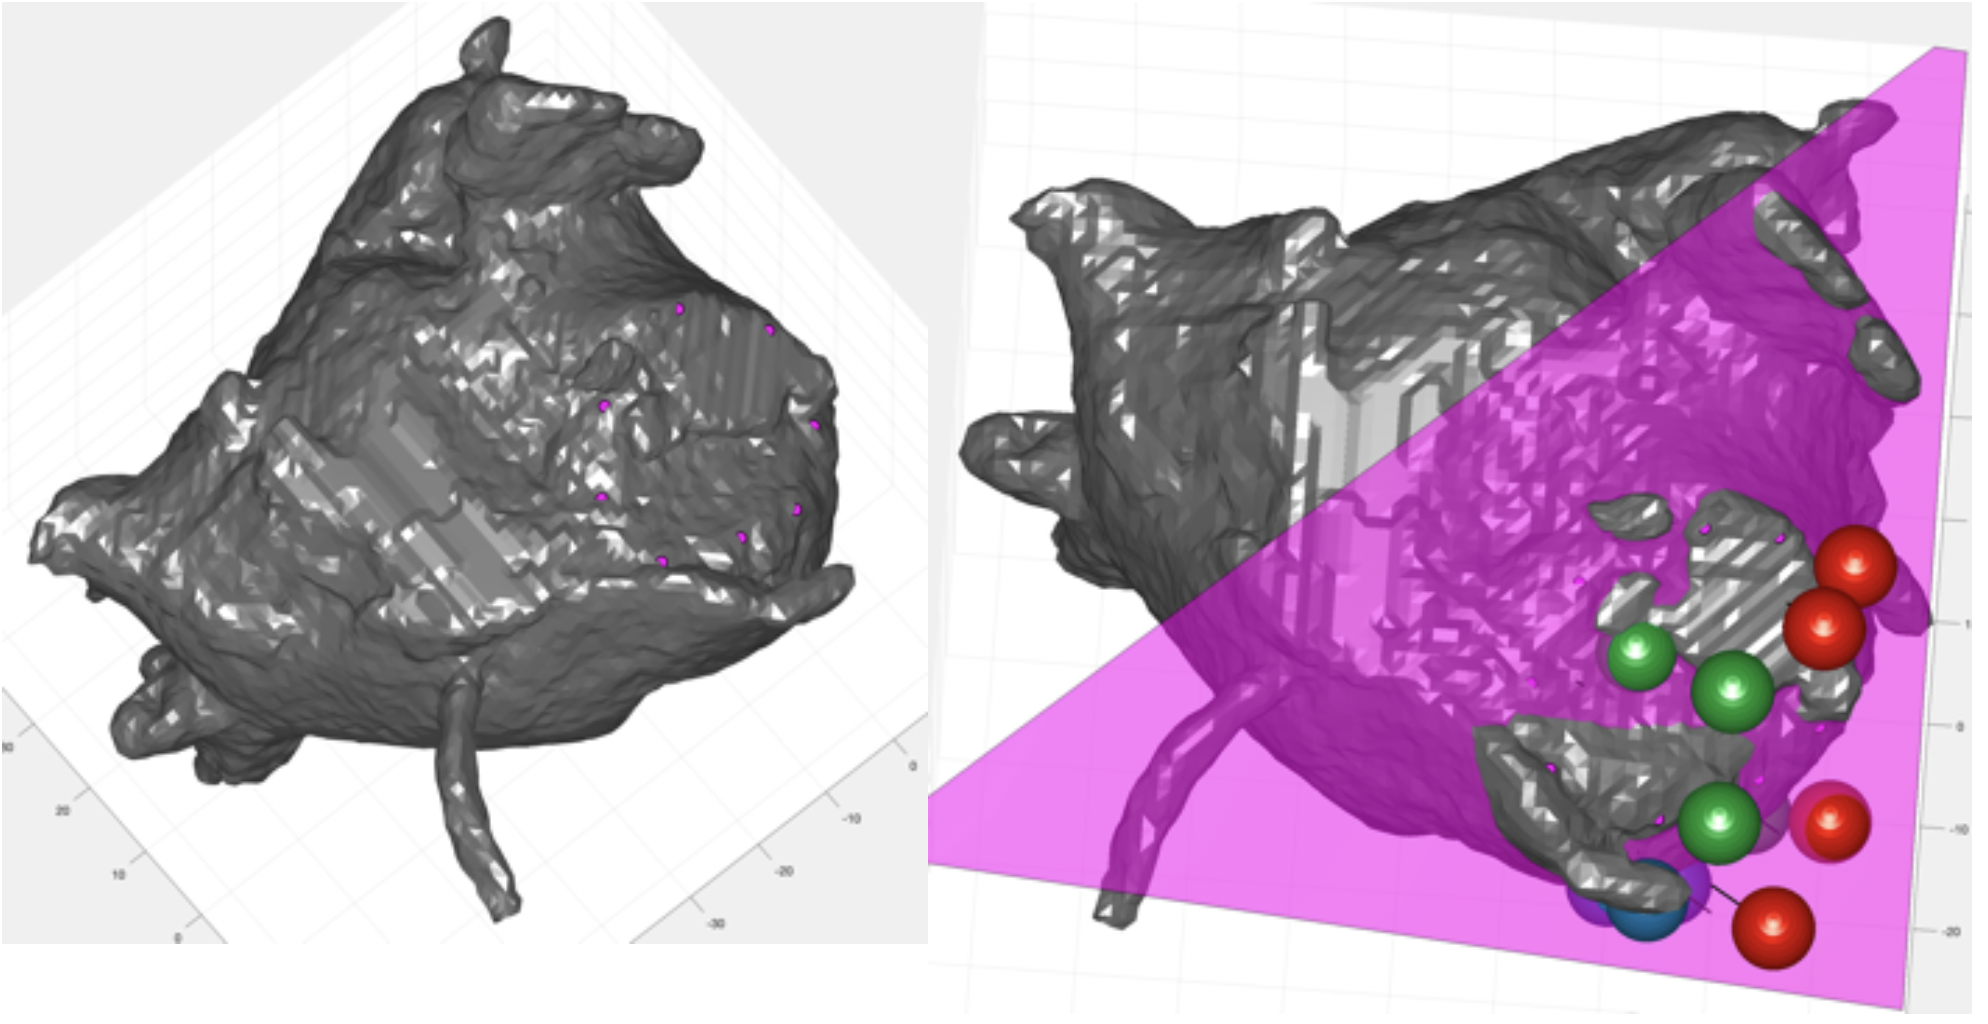
Measure the voltages of the ventricular and atrial electrograms
- Run
partIIVoltages.mand use this programme to measure the voltages of the ventricular and atrial electrograms. This will store the voltages in a cell array called voltages, since the number of measured voltages will depend on the number of electrograms present. As detailed here use left click+drag and ctrl left click+drag (or right click+drag) for atrial and ventricular electrograms, respectively.% Measure the electrogram voltages partIIvoltages;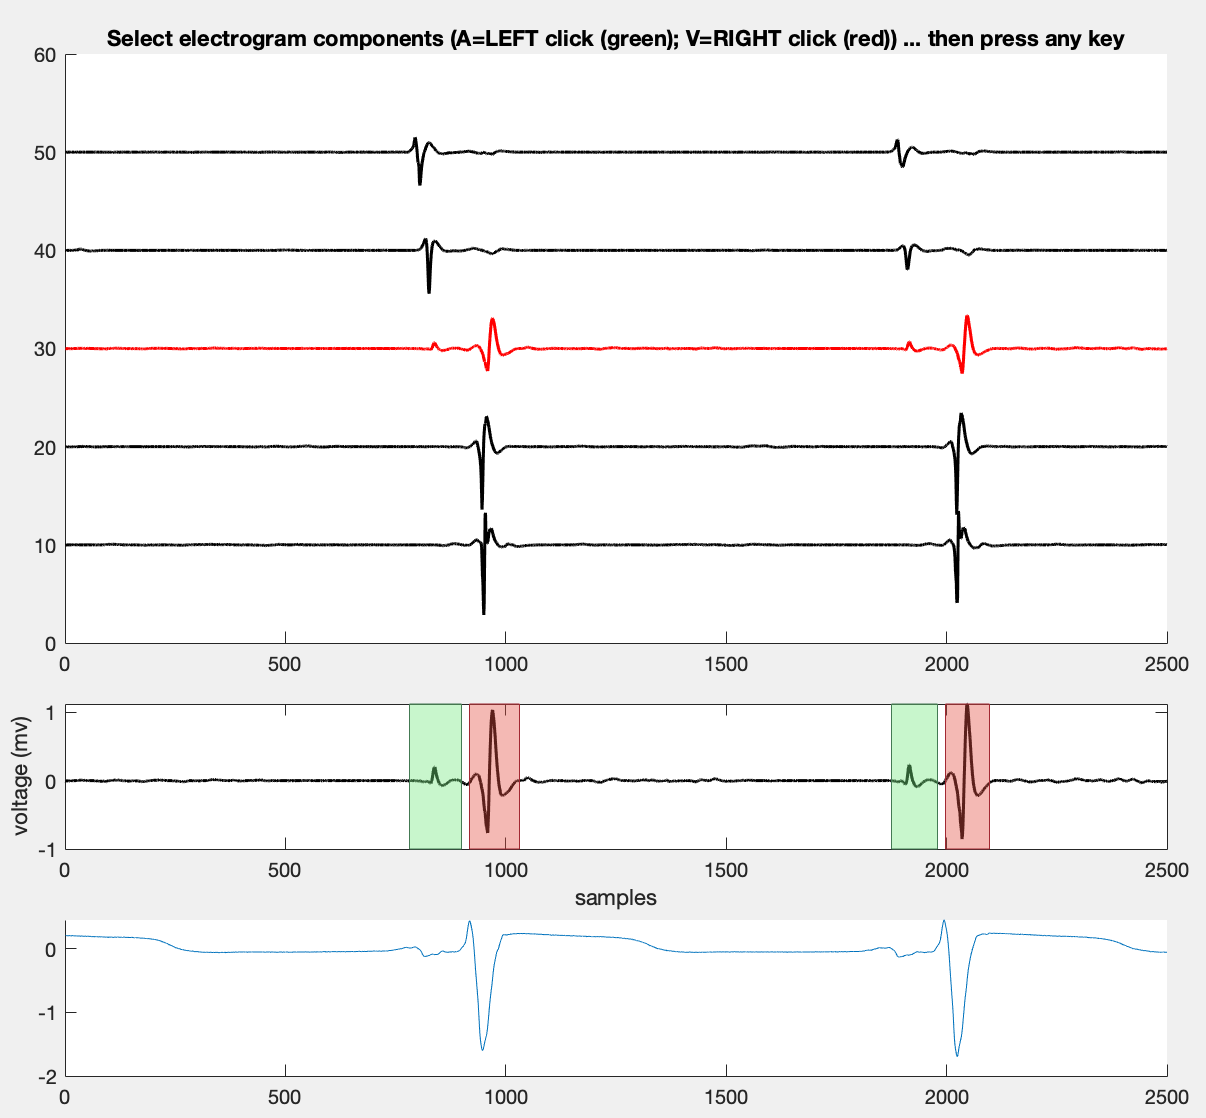
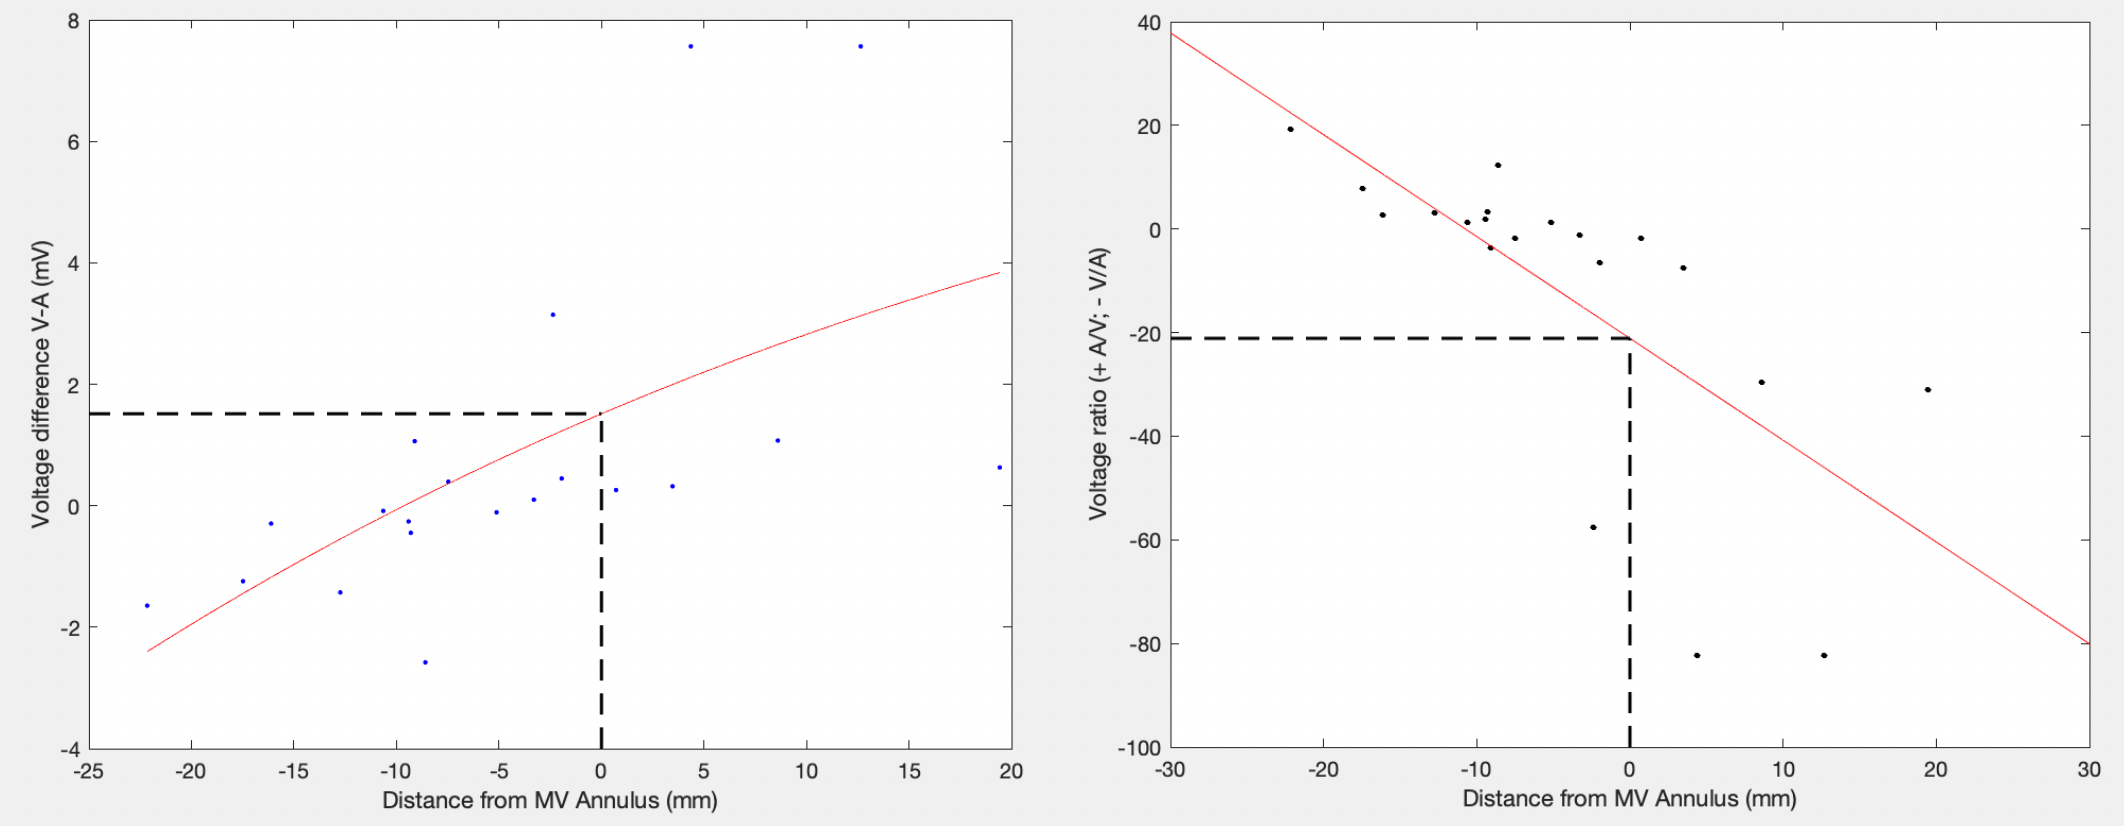
Analyse the Data
- Run
partIIIAnalysis.mto analyse the data% Analyse the data partIIIAnalysis;Two values are output - the difference in the A/V electrogram voltage at the mitral valve annulus (in mV) and the ratio of the A/V electrograms at the mitral valve annulus. By definition negative ratio indicates that the V electrogram is bigger than the A electrogram; whilst a positive ratio is given for A electrograms greater in amplitude than V electrograms.
- Alternatively, run
partIVRegionalAnalysis()% Analyse the data partIVRegionalAnalysis();This function will summarise the data from all cases that are listed in the top of the function. Additionally it will summarise the data separately for each region around the mitral valve annulus.