Calculate Fibrosis Burden
Table of contents
Background
This page describes one method for calculating fibrosis burden, for example to calculate the percentage of the left atrium with a fibrosis burden greater than a threshold.
The technique used is the image intensity ratio [REF] where the threshold chosen is image intensity ratio x mean left atrial blood pool signal intensity.
Quickstart
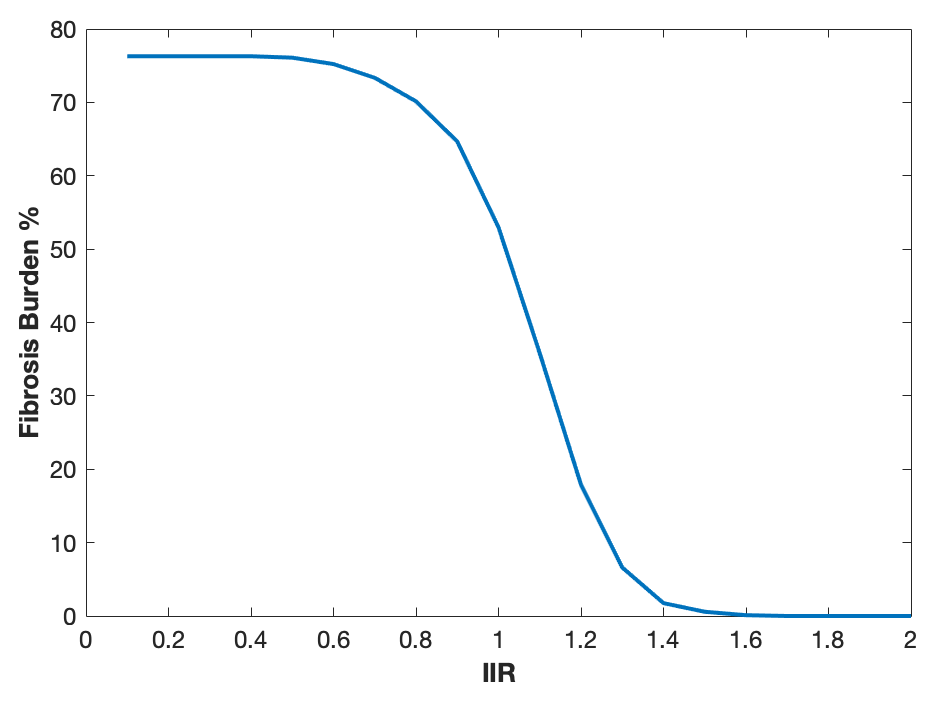
% set up variables
vtkFile = <path to vtk file>
prodStatsFile = <path to prodStats file>
iir = 0.1:0.1:2.0;
% run imageIntensityRatioFibrosisBurden.m
[fibrosisBurden, threshold] = imageIntensityRatioFibrosisBurden(vtkFile,prodStatsFile,iir);
plot(iir,fibrosisBurden);
Dependencies
The analysis runs entirely in Matlab based on the WLC library. In particular
thresholdVtkArea.m
Process
This protocol depends on thresholdVtkArea.m which accepts a VTK file and a threshold range and calculates the surface area of the shell described in the VTK file which has scalar parameter values within a min/max range.
It is possible to use either point data or cell data with thresholdVtkArea.m by setting the 'pointorcell' input parameter-value pair to either 'point' or 'cell', respectively.
Since we want to know, usually, the area of the shell with a signal intensity greater than a threshold; we set the 'threshold' input parameter to [iir Inf] which will return the area with signal intensity greater than iir and less than Inf.
Since the image intensity ratio process uses the blood pool mean as a reference, we also want to know the actual thresholds used for calculating area; these are return as the second output argument of imageIntensityRatioFibrosisBurden.m
The following code can be used to batch-process a folder of VTK and associated prodstats files.
dir = <pathname>; % specify folder

vtkFiles = nameFiles(dir, 'extension', 'vtk');
txtFiles = nameFiles(dir, 'extension', 'txt');
iir = 0.1:0.05:3.0;
fibrosisBurden = NaN(numel(vtkFiles),numel(iir));
h = waitbar(0,'Please wait ...');
for i = 1:numel(vtkFiles)
    [fB, ~] = imageIntensityRatioFibrosisBurden([dir filesep() vtkFiles{i}],[dir filesep() txtFiles{i}],iir);
    fibrosisBurden(i,:) = fB;
    waitbar(i/numel(vtkFiles),h);
end
A similar implementation is included in run_imageIntensityRatioFibrosisBurdenExperiment.m which also will output a graph.