Measure Electrogram Amplitudes
Table of contents
Background
Electrogram voltage is a commonly-used metric in clinical (but less so in laboratory) electrophysiology. This simple program allows measurement of electrogram voltage in two categories (Va and Vb).
Quickstart
e = rand(1000,1); % simulate some data
voltagecalipers(e);
ud = get(gcf, 'userdata');
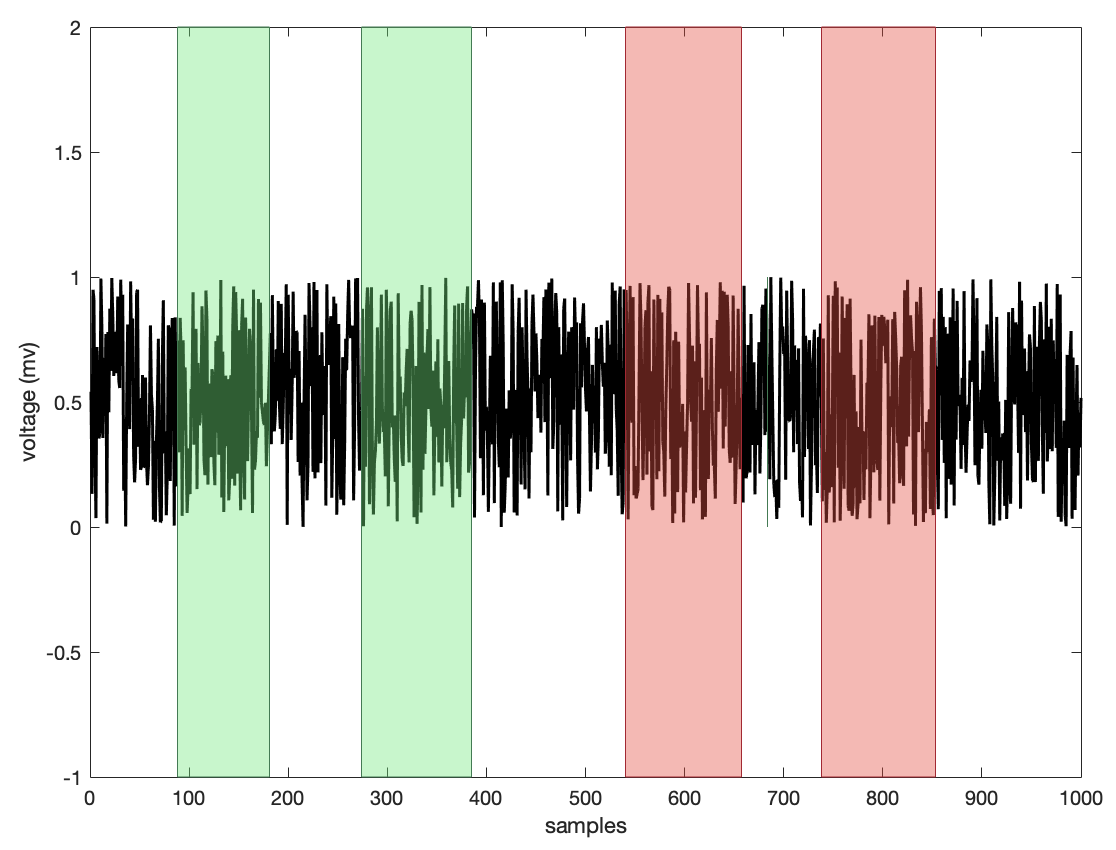
Use left click+drag to measure voltage of sections of the electrogram time series and store in Va. (ctrl click+drag to store in Vb).
Description
Left click+drag highlights the section of voltage measurement in green. Ctrl click+drag highlights the section of voltage measurement in red.

Data is stored in a structure in the Figure’s userdata.
Access the measured voltages with:
ud = get(gcf, 'userdata')

ud =

  struct with fields:

    Va: [0 0.94338 0.99331]
    Vb: [0.96277 0.98433]